Note
Go to the end to download the full example code.
Checking running times and error for different parameters
This example shows how the running time and estimation error varies over a mock dataset
while changing the coalition_size.
We will start by setting up the imports, environment variables and a basic score function that will be used to determine rankings.
import numpy as np
import matplotlib.pyplot as plt
from sklearn.utils import check_random_state
from sharp import ShaRP
from sharp.utils import scores_to_ordering

import time
import pandas as pd


# Set up some environment variables
RNG_SEED = 42
N_SAMPLES = 500
N_EXPLAIN = 50
rng = check_random_state(RNG_SEED)


def score_function(X):
    return X.mean(axis=1)
We can now generate a simple mock dataset with 2 features, one sampled from a normal distribution, another from a bernoulli.
X = np.concatenate(
    [
        rng.normal(size=(N_SAMPLES, 1)),
        rng.normal(1, 0.5, size=(N_SAMPLES, 1)),
        rng.normal(0.3, 0.5, size=(N_SAMPLES, 1)),
        rng.normal(1, 0.75, size=(N_SAMPLES, 1)),
        rng.binomial(1, 0.5, size=(N_SAMPLES, 1)),
    ],
    axis=1,
)
y = score_function(X)
rank = scores_to_ordering(y)

x_explain = X[rng.choice(np.arange(X.shape[0]), size=N_EXPLAIN)]

# Calculate feature contributions using all coalitions
xai = ShaRP(
    qoi="rank",
    target_function=score_function,
    measure="shapley",
    sample_size=50,
    coalition_size=None,
    replace=False,
    random_state=RNG_SEED,
)
xai.fit(X)

start = time.time()
ftr_contrs_exact = xai.all(x_explain)
end = time.time()
Run ShaRP using different coalition sizes
# Calculate the approximations
cols = ["coalition_size", "time", "error"]
results = [["exact", (end - start) / N_EXPLAIN, 0]]

for coal_size in range(1, X.shape[-1]):
    xai = ShaRP(
        qoi="rank",
        target_function=score_function,
        measure="shapley",
        sample_size=50,
        coalition_size=coal_size,
        replace=False,
        random_state=RNG_SEED,
    )
    xai.fit(X)

    start = time.time()
    ftr_contrs_curr = xai.all(x_explain)
    end = time.time()

    data = [
        coal_size,
        (end - start) / N_EXPLAIN,
        np.mean(np.abs(ftr_contrs_curr - ftr_contrs_exact)),
    ]
    results.append(data)

results = pd.DataFrame(results, columns=cols)
results
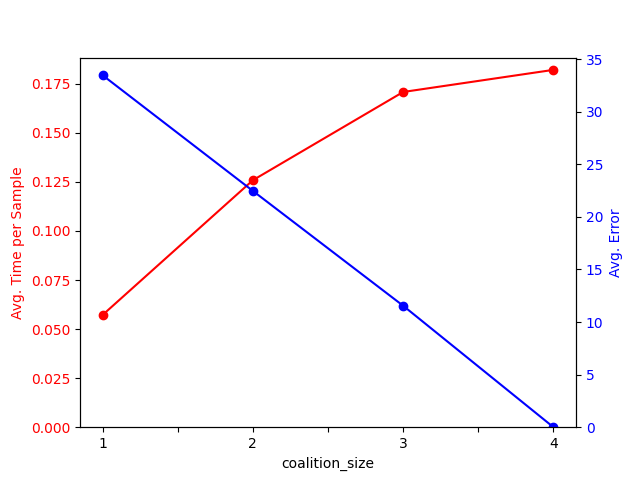
Let’s visualize the results:
res_ = results[results["coalition_size"] != "exact"]

fig, ax1 = plt.subplots()

res_.plot.line("coalition_size", "time", color="red", marker="o", ax=ax1)
ax1.tick_params(axis="y", labelcolor="red")
ax1.set_ylabel("Avg. Time per Sample", color="red")
ax1.set_ylim(bottom=0)
ax1.get_legend().remove()

ax2 = ax1.twinx()
res_.plot.line("coalition_size", "error", color="blue", marker="o", ax=ax2)
ax2.tick_params(axis="y", labelcolor="blue")
ax2.set_ylabel("Avg. Error", color="blue")
ax2.set_ylim(bottom=0)
ax2.get_legend().remove()

plt.show()
Run ShaRP using different sample sizes
x_explain = X[rng.choice(np.arange(X.shape[0]), size=N_EXPLAIN)]

# Calculate feature contributions using all coalitions
xai = ShaRP(
    qoi="rank",
    target_function=score_function,
    measure="shapley",
    sample_size=50,
    coalition_size=None,
    replace=False,
    random_state=RNG_SEED,
)
xai.fit(X)

start = time.time()
ftr_contrs_exact = xai.all(x_explain)
end = time.time()

# Calculate the approximations
cols = ["sample_size", "time", "error"]
results = []

for sample_size in range(10, 51, 10):
    xai = ShaRP(
        qoi="rank",
        target_function=score_function,
        measure="shapley",
        sample_size=sample_size,
        coalition_size=None,
        replace=False,
        random_state=RNG_SEED,
    )
    xai.fit(X)

    start = time.time()
    ftr_contrs_curr = xai.all(x_explain)
    end = time.time()

    data = [
        sample_size,
        (end - start) / N_EXPLAIN,
        np.mean(np.abs(ftr_contrs_curr - ftr_contrs_exact)),
    ]
    results.append(data)

results = pd.DataFrame(results, columns=cols)
results
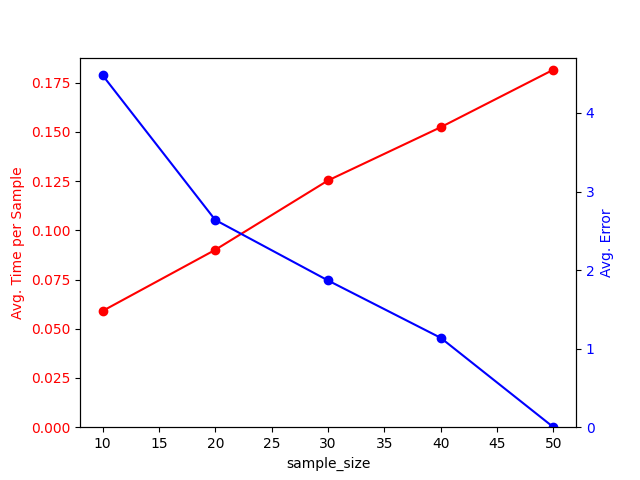
Let’s visualize the results:
res_ = results[results["sample_size"] != "exact"]

fig, ax1 = plt.subplots()

res_.plot.line("sample_size", "time", color="red", marker="o", ax=ax1)
ax1.tick_params(axis="y", labelcolor="red")
ax1.set_ylabel("Avg. Time per Sample", color="red")
ax1.set_ylim(bottom=0)
ax1.get_legend().remove()

ax2 = ax1.twinx()
res_.plot.line("sample_size", "error", color="blue", marker="o", ax=ax2)
ax2.tick_params(axis="y", labelcolor="blue")
ax2.set_ylabel("Avg. Error", color="blue")
ax2.set_ylim(bottom=0)
ax2.get_legend().remove()

plt.show()
Total running time of the script: (12 minutes 45.449 seconds)